Every QR scan logs the date, time, country, city, and device type. Filter by card, date range, or source. See which trade show generated the most scans, which rep's card is performing, which campaign converted.
Total scans is the least useful metric. You need to know which event drove them, which rep's card is converting, what country your leads come from.
"You've had 247 scans this month." That's it. No timeline, no source attribution, no country breakdown. You spent $5,000 on a trade show — did it work? No idea.
Filter scans by card, date, country, or city. See the daily trend, top-scanning cards, top countries. Tag a card with a campaign source ("trade-show-2026"), see ROI per event. All inside your WordPress admin.
Three views of the data — pick the one that fits the question you're asking.
See scans for the last 7 days, 30 days, this month, last quarter, or custom range. Spot trends, identify seasonal patterns, measure post-event traffic spikes.
Tag a card with a campaign source ("event-berlin-2026" vs "default" vs "linkedin-bio"). Filter scans by tag to compare campaigns. Which trade show actually generated leads? Now you know.
Each scan logs the visitor's country and city (based on IP, no personal data). See where your audience actually lives. Plan your next trade show in the city with the most existing scans.
Analytics is on by default. Disable per-card if you want.
You create a card in WordPress admin. The plug-in automatically starts logging every QR scan and every short-link visit.
Someone scans your QR or opens the short link. The plug-in records timestamp, country/city (from IP), device type. No cookies, no tracking pixel, no third-party JS.
In WordPress admin → QR vCard Pro → Analytics, you see a dashboard with filters. Pick a date range, a card, a source tag. Get a chart, a list, and a CSV export.
These are real questions our users ask — and now have answers to.
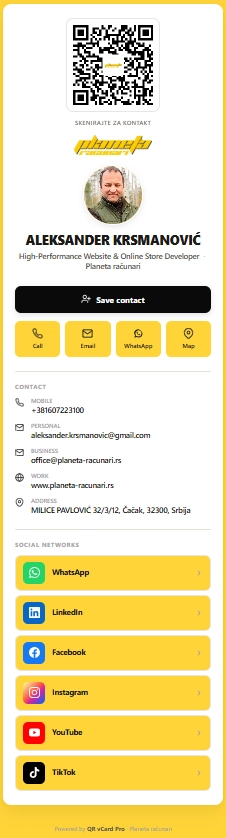
The plug-in is built and maintained by Aleksander Krsmanović. His own card runs on the same code you'd be buying. Scan it, save the contact, or just see how a real card looks on a phone.
planeta-racunari.rs/q/FejWtKYes. The plug-in logs IP-based country/city (anonymized at the city level, not street level), timestamp, and device type. No cookies, no tracking pixel, no personal data unless the visitor explicitly submits the Contact Capture form. Your privacy policy covers it without third-party processors.
Yes — the plug-in has its own analytics built in, no Google Analytics or any third-party service needed. Data lives in your WordPress database. If you do use Google Analytics on the rest of your site, the plug-in analytics is independent and doesn't interfere.
Yes — filter by card name, source tag, and date range. Common workflow: tag each card with the event ("event-ces-2026", "event-mobile-world-2026"), then filter analytics by tag to compare event ROI directly.
IP-based geolocation is country-accurate ~99% of the time, and city-accurate ~70-80% of the time. VPN users get mis-located (that's a limitation of all IP geolocation, not specific to this plug-in). For most use cases — "where are my scans coming from?" — it's plenty accurate.
Yes — every analytics view has a CSV export button. Date, card, country, city, device. Load into Excel, Google Sheets, Tableau, Power BI, or any tool that reads CSV. For real-time data sync to a BI tool, we offer custom integration on a consulting basis.
$99 one-time for 5 Sites tier. Geo Analytics, Email signature, Virtual backgrounds, 5 sites, license migration.
See pricing